Data Visualisation in React
I think data visualisation is one of the most interesting parts of frontend web development. It is also one of the parts I think can quickly get intimidating. With most parts of software engineering, at least in the domains I practise, I have an idea of how something could be implemented, even though my implementation could be inefficient. However, with data visualisation, I will find myself stumped. Especially with more complex visualisations like this map of notable people around the world. I have no idea how it was created and could not hope to replicate it without significant research. To be fair, I have done very little visualisation. So far, exactly a single instance (outside of Free Code Camp’s section in D3.js).
Working on visualising data has made me realise that as far as my purposes go, and this will be the case with most engineers, I do not need to visualise significantly complex data. Maybe I will learn, if my interests or careers take me there. However, until then, it is fine to learn the simple visualisations that are used in a vast majority of cases. This will be charts: bar charts, pie charts, and line charts. And Apex Charts makes it easy enough to implement.
The first step, as with most React libraries, is to install react-apexcharts in your app and import it in your component:
import Chart from "react-apexcharts";
Once you have imported Apex Charts into your component, you would need to create a state for the chart. The chart state is an object that has two keys: series and options. The series key has an array value, with one object inside it. The object within has name and data keys and represent the data that will be displayed in your chart. The data is an array of all data you wish to display on the chart. It should look like so:
        series: [


            {


                name: "series-1",


                data: [30, 40, 45, 50,
        49, 60, 70, 91]


            }


        ]
In the above code, the data displayed in the chart will carry the name series-1, with the data in the array represented in the chat.
The second key in the chart state, options, represents configurations for your chart and affects how it should look. There are many options you can include, to alter behaviour and even the style. However, the essential keys are the chart key and the xaxis key. The chart key determines what kind of chart you use: line, bar, or even a donut chart. You will represent this as an object, with the type of chart coming as a key/value pair of the id and the chart name. It would look like so for a bar chart:
        chart: {


            id: "basic-bar"


        },
The xaxis represents the values that would lie along the x-axis of the chart. It should look like so:
        xaxis: {


            categories: [1991, 1992, 1993, 1994, 1995, 1996,
        1997, 1998,1999]


        }
Since years from 1991 till 1999 are in the array, a chart created with that configuration will carry those years along the x-axis. By default, Apex Charts will help you determine the values that should be put along the y-axis based on the data in your series. However, you can also configure this with the yaxis property.
You will pass the chart state to your Chart component. When you use the imported Chart component, you need to pass three props to it: options, series, and type. The options prop will be the options key from your chart state, and the same goes for the series. The type will depend on the kind of chart you want, and should be a string of bar in this case since we decided on a bar chart above. There are other optional props like the height and width.
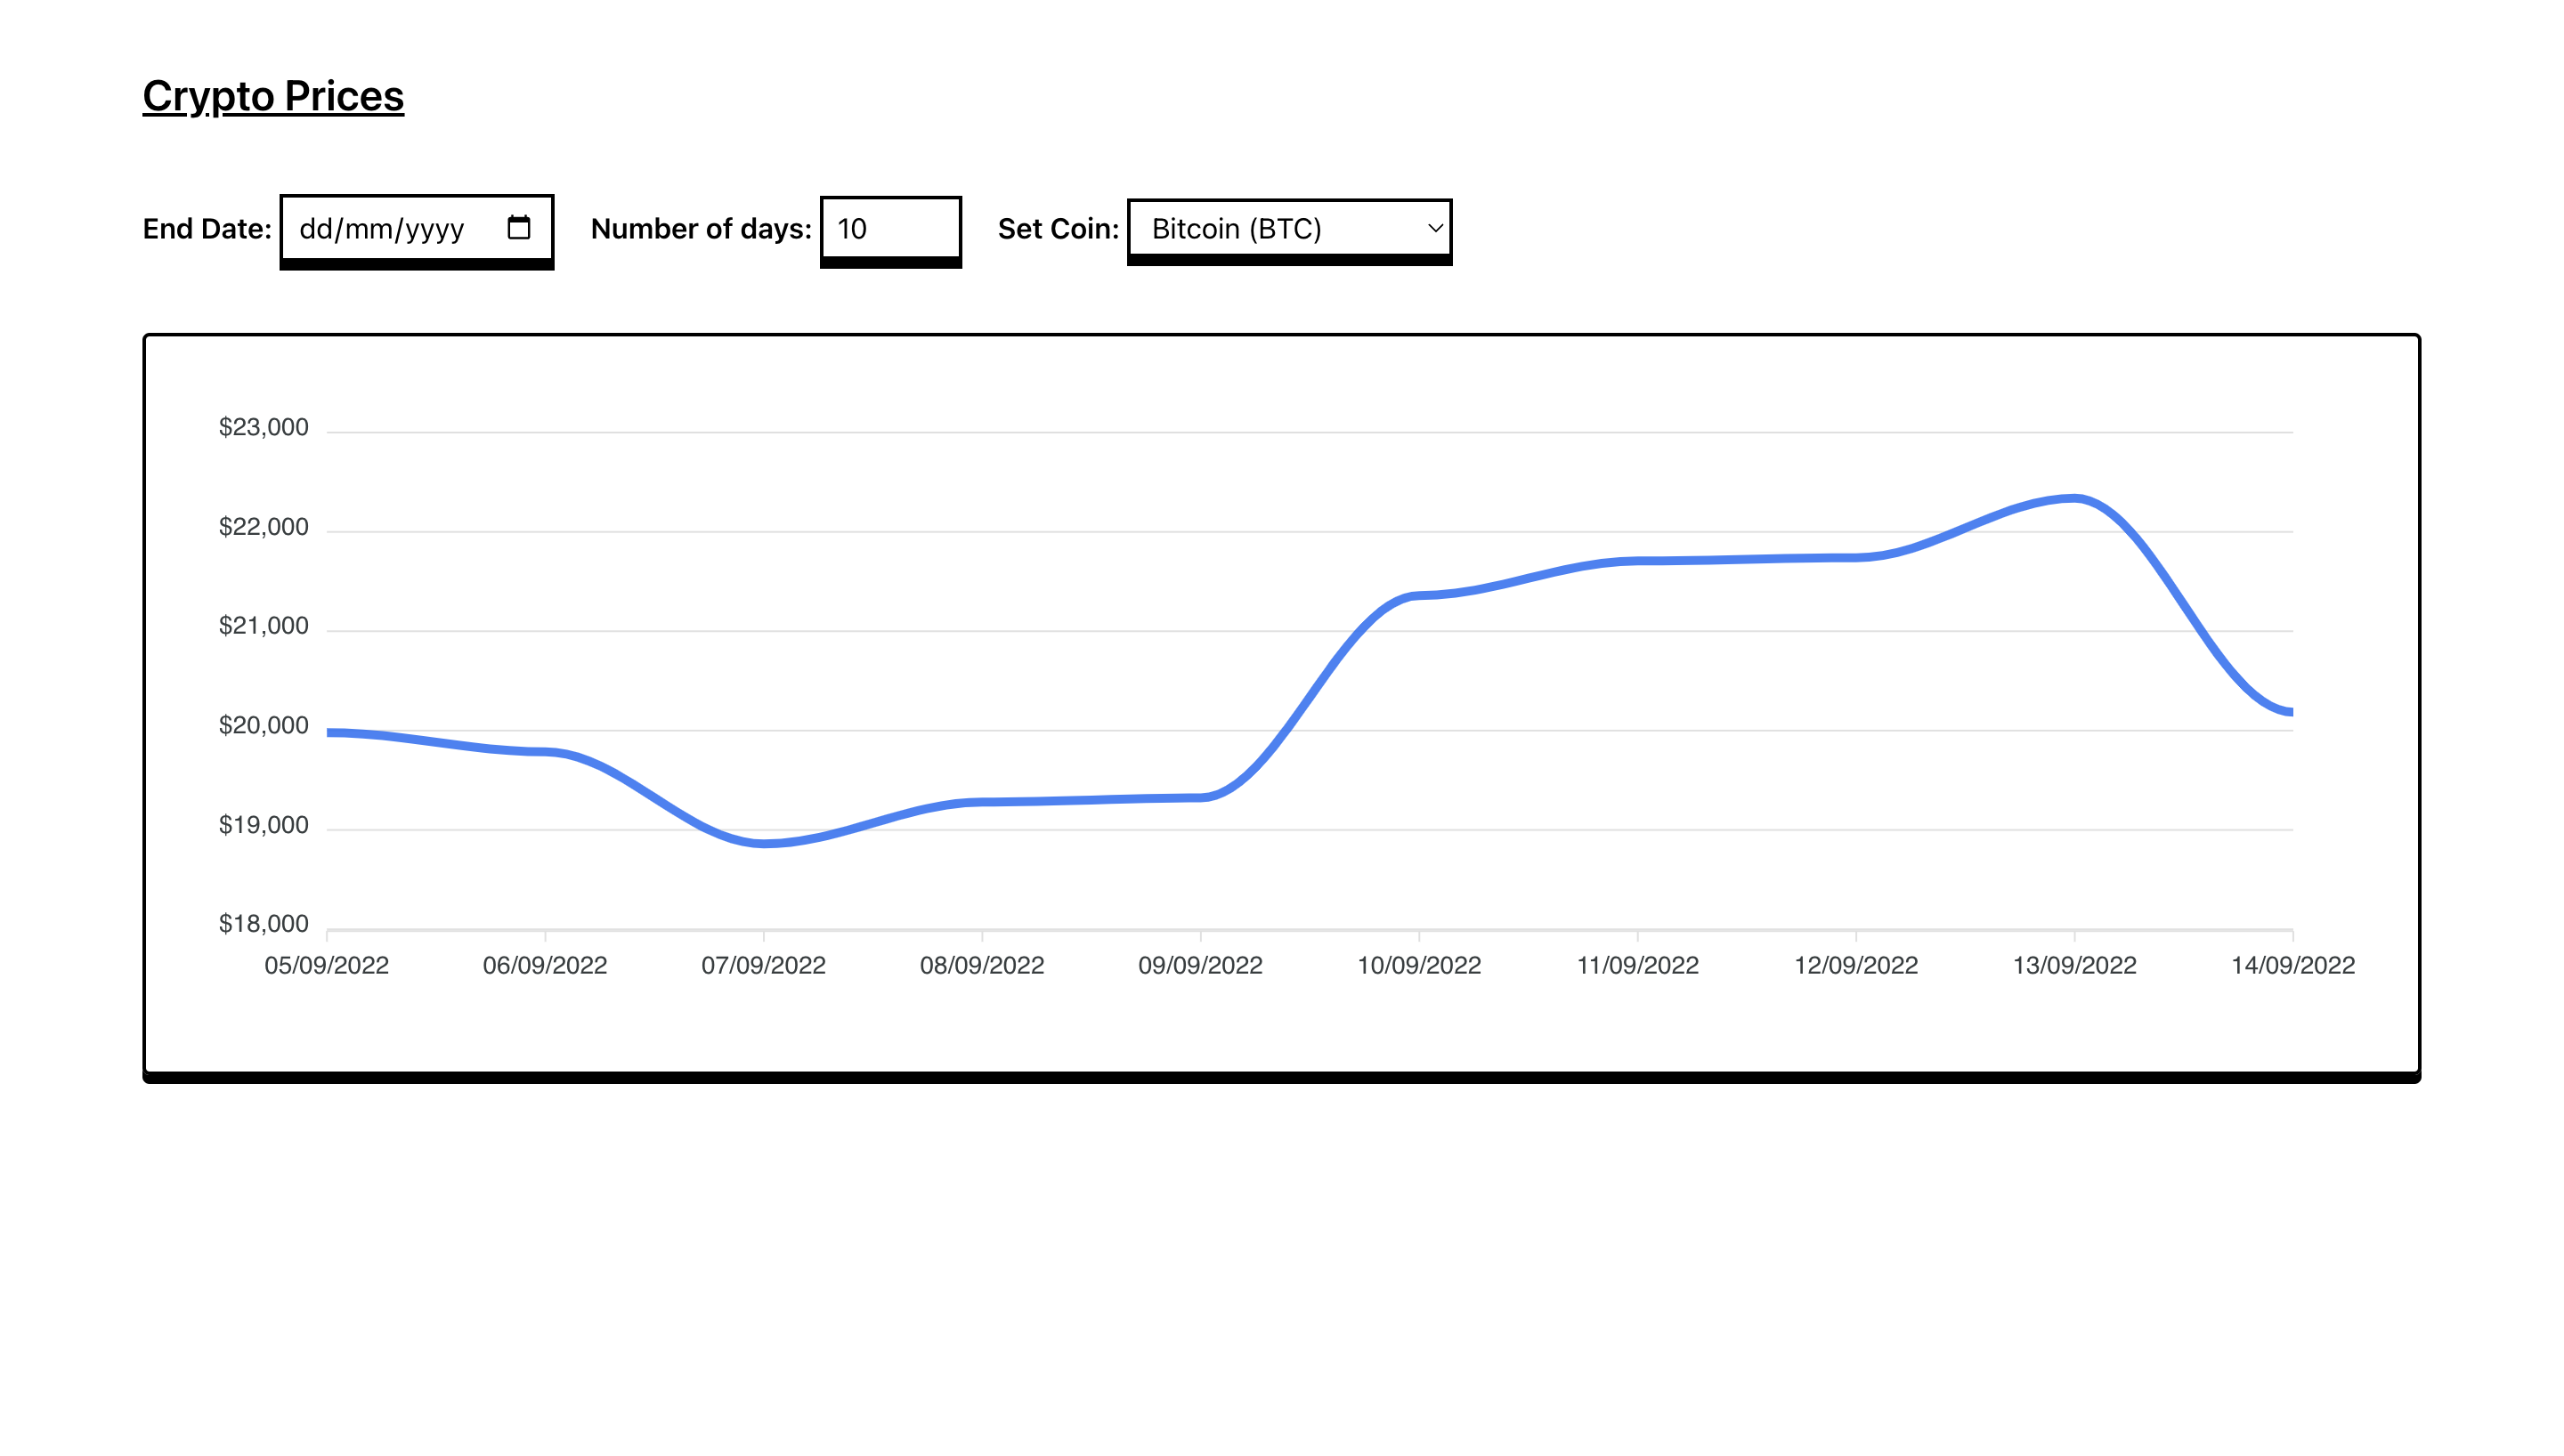
Here is a line chart I created with Apex Charts available at crypto.fawazharoun.com in production and also on Github: